Preferences
controls the appearance of the current schematic — line widths, colours and fonts.
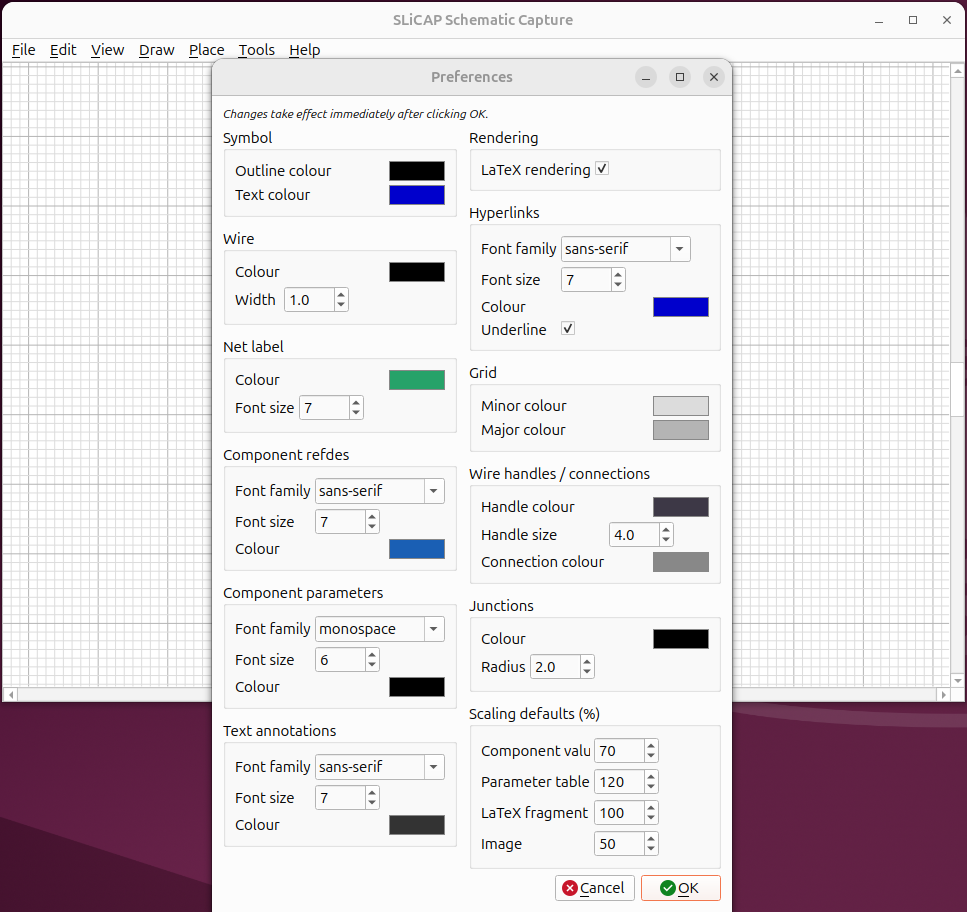
Fig. 33 The Preferences dialog, grouped by element type.
Per-schematic styling
Styling works on two levels:
The application’s global defaults are the template for every new schematic.
When you change a setting in Preferences, it applies to the current schematic and is saved into its
<name>.inisidecar file (see Projects). Re-opening that schematic restores exactly the look it was saved with — independent of the machine’s global defaults.
This is what lets a book or report keep a consistent house style across all its figures.
What you can change
The dialog is grouped by element type, including:
Symbol — stroke and text colour.
Wire — colour and width.
Net label, Component refdes, Component parameters — colour, font and size.
Text annotations, Hyperlinks — fonts and colours.
Grid — minor and major line colours.
Wire handles / connections — the colour and size of wire selection handles, and the connection colour used for the unconnected-pin markers (see Wiring).
Junctions — colour and radius.
Rendering — turn LaTeX typesetting of labels on or off. Leave it off in NGspice schematics: a simulator expression is code, not mathematics, and only the part of it that is also valid mathematics can be typeset. A value that cannot be typeset is shown as plain text — it is never rendered wrongly. If you want a typeset expression on an NGspice schematic, either accept the generated form, or hide the value and place the formula yourself with ; such a snippet is for display only and is not netlisted.
Scaling defaults — default sizes for parameter tables, LaTeX fragments and images.
Changes take effect immediately on the canvas.
Grid
Three grids: the minor lines (the grid step), the major lines (every eight minor cells) and the subgrid, a dot on every point of the fine grid, one fifth of the grid step, the grid that shapes snap to while Shift is held. Each has its colour; View subgrid switches the dots on, and they appear when the zoom keeps them apart.
Border
The Border group sets the look that a new border gets when it is placed (Place > Border): line colour and width, background colour and opacity, and whether the dashed line is drawn in the exported SVG/PDF. An existing border keeps its own values, edited in the Border dialog. A background at opacity 0 % is invisible; choosing a background colour in the Border dialog therefore sets the opacity to 100 % when it was 0 %.
For figures in a document, set the background here once per schematic style,
e.g. bg_color = #ecf3ff, bg_alpha = 100, show_line_in_export =
false in the [border] section of the schematic’s .ini sidecar, and
give every border the width of the document column (see the sch_scale
setting under Projects).
Colour scheme
on the main window has a Colour scheme: system follows the desktop, light and dark force one. The window chrome follows through Qt. On a dark scheme the canvases draw on a dark background with every colour’s lightness inverted for the screen only: black wires show white, white fills dark, red stays red; LaTeX renders (labels, parameter table, model and analysis blocks, fragments) show their black as white. A change of the desktop scheme while SLiCAP runs is followed at once. The schematic style, and therefore every SVG and PDF export, keeps the document colours.